Whenever approaching topics like covariance or correlation, always start with a simple question.
How do two things change together?
That question is actually the foundation for both covariance and correlation.
Lorem ipsum dolor sit amet, consectetur adipiscing elit. Ut elit tellus, luctus nec ullamcorper mattis, pulvinar dapibus leo.
Covariance: The First Step Toward Understanding Relationships
Think of covariance as the most basic way to detect whether two variables are connected in their movement.
- When both variables increase or decrease together, the covariance turns positive.
- When one increases while the other decreases, it becomes negative.
- When there’s no consistent pattern, it hovers around zero.
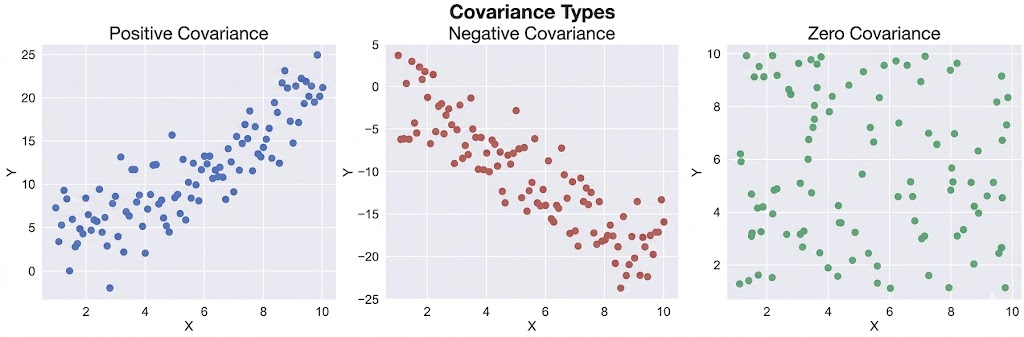
At a conceptual level, this is quite intuitive. It tells us whether two quantities are moving in sync or in opposition.
However, when working with actual data, you would realize something important:
Covariance gives direction, but not clarity.
To make these ideas concrete, I like to walk through a small example step by step.
Let’s consider two variables:
$$X: \text{Hours spent practicing}$$ $$Y: \text{Performance score}$$
Consider their values:
$$\begin{aligned}
X &= \{1, 2, 3, 4, 5\} \\
Y &= \{2, 4, 6, 8, 10\}
\end{aligned}$$
Step 1: Find the Means
Compute the mean for both the variables.
$$\begin{aligned}
\bar{X} &= \frac{1+2+3+4+5}{5} = 3 \\
\bar{Y} &= \frac{2+4+6+8+10}{5} = 6
\end{aligned}$$
Step 2: Compute Covariance:
The idea here is simple: measure how deviations from the mean move together.
$$\text{Cov}(X, Y) = \frac{1}{n} \sum (x_i – \bar{x})(y_i – \bar{y})$$
Now calculate each of them
$$\begin{array}{ccccc}
X & Y & X – \bar{X} & Y – \bar{Y} & \textbf{Product} \\
\hline
1 & 2 & -2 & -4 & 8 \\
\hline
2 & 4 & -1 & -2 & 2 \\
\hline
3 & 6 & 0 & 0 & 0 \\
\hline
4 & 8 & 1 & 2 & 2 \\
\hline
5 & 10 & 2 & 4 & 8
\end{array}$$
Sum of products = 8+2+0+2+8=20
$$\text{Cov}(X, Y) = \frac{20}{5} = 4$$
Here, as you can see, the covariance is positive, indicating that both variables increase together.
Correlation: Bringing Clarity to the Relationship
Moving a step forward, correlation builds on covariance but makes it far more interpretable.
Instead of arbitrary values, correlation confines the relationship within a fixed range:
• +1 indicates a perfect positive relationship
• -1 indicates a perfect negative relationship
• 0 indicates no linear relationship
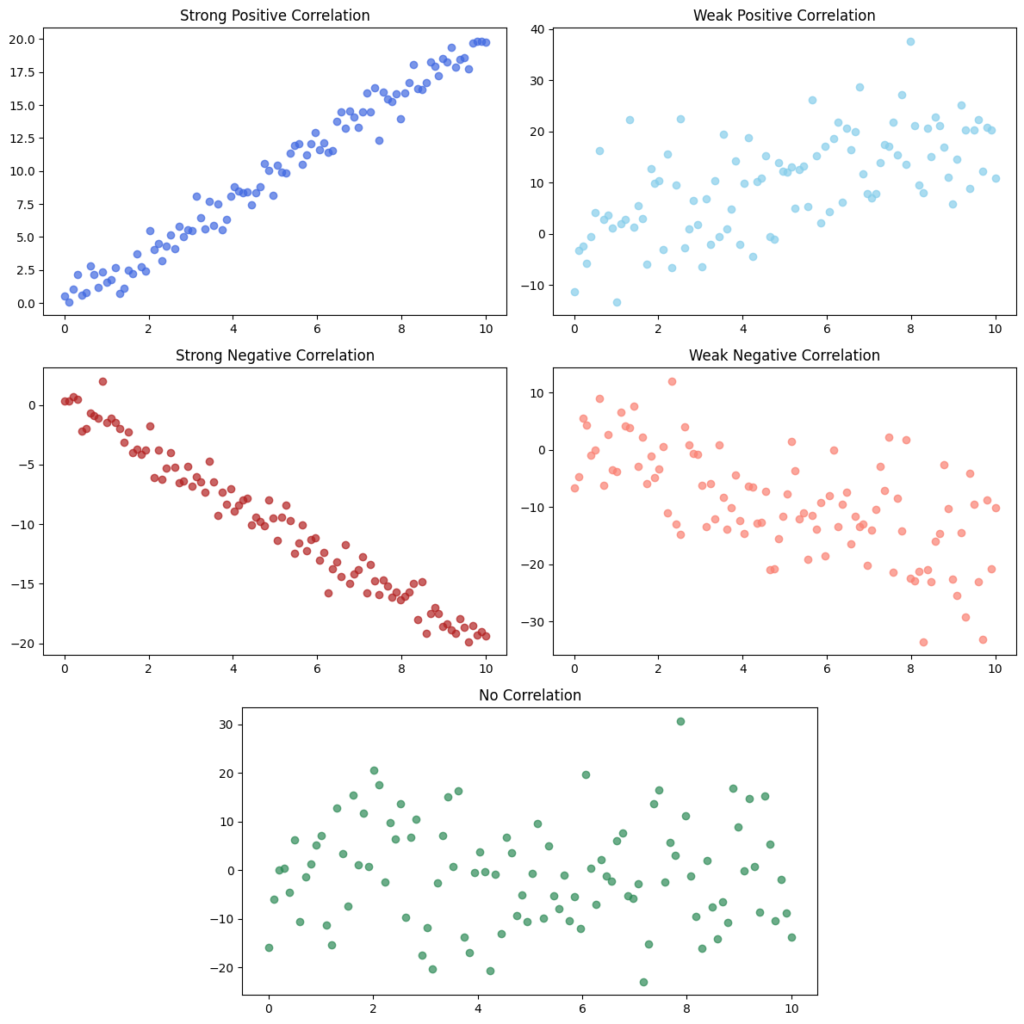
The above image shows the different types of correlation and how the data appear on the plot.
Now, going back, let’s find the correlation to our dataset:
We already found the covariance as 4. Now computing the correlation.
Compute Correlation
Normalize the covariance using standard deviations.
$$r = \frac{\text{Cov}(X, Y)}{\sigma_X \sigma_Y}$$
Find the standard deviation of both variables X and Y.
Standard Deviation of X:
$$\sigma_X = \sqrt{\frac{(-2)^2 + (-1)^2 + 0^2 + 1^2 + 2^2}{5}} = \sqrt{2}$$
Standard Deviation of Y:
$$\sigma_Y = \sqrt{\frac{(-4)^2 + (-2)^2 + 0^2 + 2^2 + 4^2}{5}} = \sqrt{8}$$
Step 4: Final Correlation:
$$r = \frac{4}{\sqrt{2} \times \sqrt{8}} = \frac{4}{4} = 1$$
Final Interpretation
- Covariance = 4 -> positive relationship.
- Correlation = 1 -> perfect positive relationship.
This tells us something very clear: as one variable increases, the other increases in a perfectly consistent way.
What You Can Take From This Example
What stands out here is how both measures tell the same story—but with different clarity.
Covariance confirms the direction
Correlation reveals the strength and perfection of the relationship
And this is exactly why, in most real situations, correlation is perfect when you want to have a complete picture of the data.
Frequently Asked Questions (FAQS)
1. What is the main difference between covariance and correlation?
Covariance tells whether two variables move in the same or opposite direction. Correlation goes a step further by also measuring how strong that relationship is, using a standardized scale between -1 and +1.
2. Why is correlation preferred over covariance in most cases?
In my experience, correlation is easier to interpret because it is normalized. Covariance values depend on the scale of the data, which can make comparisons difficult, whereas correlation provides a consistent measure across different datasets.
3. Can two variables have zero correlation but still be related?
Yes, and this is something that often gets overlooked. A correlation of zero only means there is no linear relationship. There could still be a non-linear relationship that correlation does not capture.
4. Does a high correlation mean one variable causes the other?
No, and this is a crucial point. Correlation only indicates a relationship, not causation. Two variables can be strongly correlated due to coincidence or the influence of a third factor.
5. When should covariance still be used?
Covariance is useful when you want a basic understanding of how variables move together, especially during initial data exploration. However, for clearer interpretation and comparison, correlation is usually the better choice.